Cash Flow Report#
The Cash Flow Report available from the Reports menu shows a summary of Income and Expenses over a given date range. Knowing what is Income and Expense depends on you providing that Category information on your transactions. See Categories.
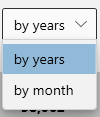
The default range is 5 years. But you can change this to a monthly comparison over 12 months, or whatever date range you want to see. Simply change the drop downs shown at the top of the report:

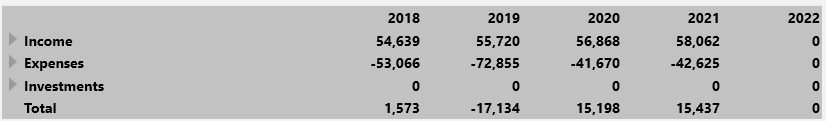
The following shows some example data generated by the Sample Data generator to show you what the report looks like. Here you see the summary organized by income, expense and investments, with columns for each year.
You can expand these summaries to see data by category, for example, if you expand Expenses you will see something like this:
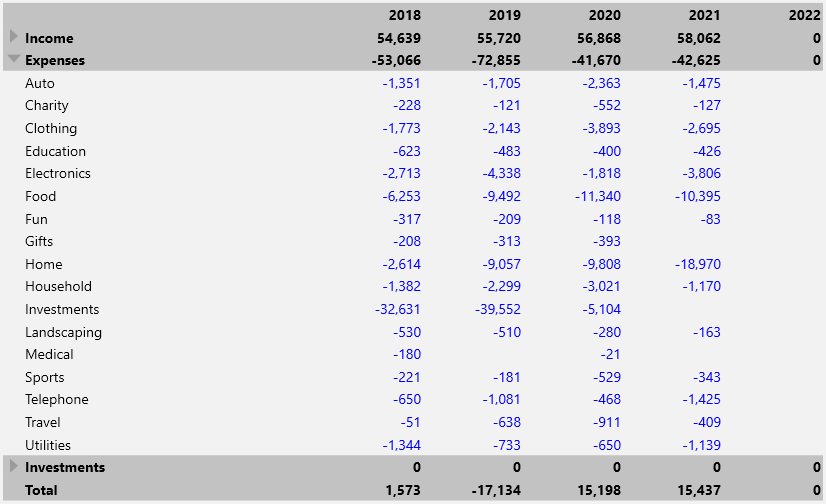
You can click any blue linked number to see the transactions behind that cell in the report. Use the back button to get back to the report.
If you have transactions with no Category or a category with type None then you will also get an "Unknown" row in your cashflow report. It also reports any Split transactions that have unassigned amounts (the splits do not add up to the transaction amount) The link here is a handy way to find all those transactions that need to be fixed.

You can change the columns so they show tallies for 1 month versus an entire year by selecting "by month" in this drop down.
You probably should reduce the date range to 1 year otherwise you will get a lot of columns!
You will also see an export button which you can use to get a .csv file that you can then play with in your favorite spreadsheet app:

The bottom of the report also shows the Net cash flow for the selected period.