History Chart#
When you are viewing by category or by payee, you can switch to the "History" tab and see the history by year, month or day:
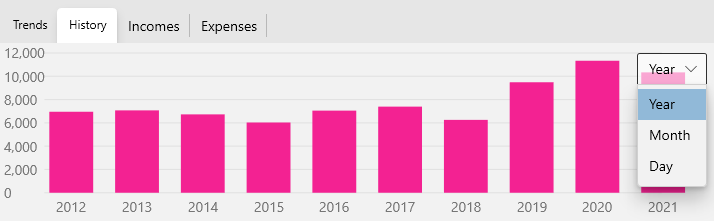
You can change the date range of each column using the drop down in the top right which is open in the above picture.
The chart will start with the default range of one Year per column up to a maximum of 24 years. If you change this to Month you will see just the last 24 months, and if you change to Day you will see the last 31 days.
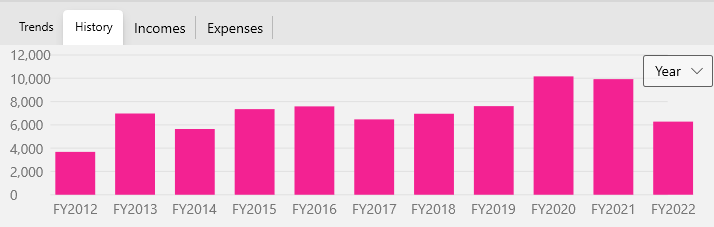
If you change the Fiscal Year Start month using the Options dialog then the Yearly columns will start on that month. For example, if the start month is July, then the fiscal year 2012 starts in July 2011 and ends in June 2012 and the columns will be labelled with an "FY" prefix to indicate this is a "Fiscal Year":
You can also drill down and view all transactions in a given column selecting the columns with the left mouse button. This will also change the Transaction View to show only the transactions behind that column. Use the main window back button to get back to the full list of transactions you were looking at:

You can right click to Export the chart data to a .csv spreadsheet.